Design Example
Oracle: Data Manager Feature
The Climate Corporation’s customers needed a way to aggregate, review and edit many years’ worth of farming activity data in a useful and efficient way.
1
Problem
The Climate.com website, known as FieldView, is Climate’s main tool in its suite of digital products. Users needed a way to aggregate and display farming activity data, both the data collected by Climate’s proprietary FieldView Drive, a device installed in farming equipment like tractors, as well as data entered into the system manually. Users need this functionality in order to plan, track, review and edit the data for planting, harvesting, and other activities on their operations, as well as to forecast revenues. The main UX challenge was to aggregate, visualize, and provide editing functionality for many years' worth of data in a useful and efficient way.
2
Users
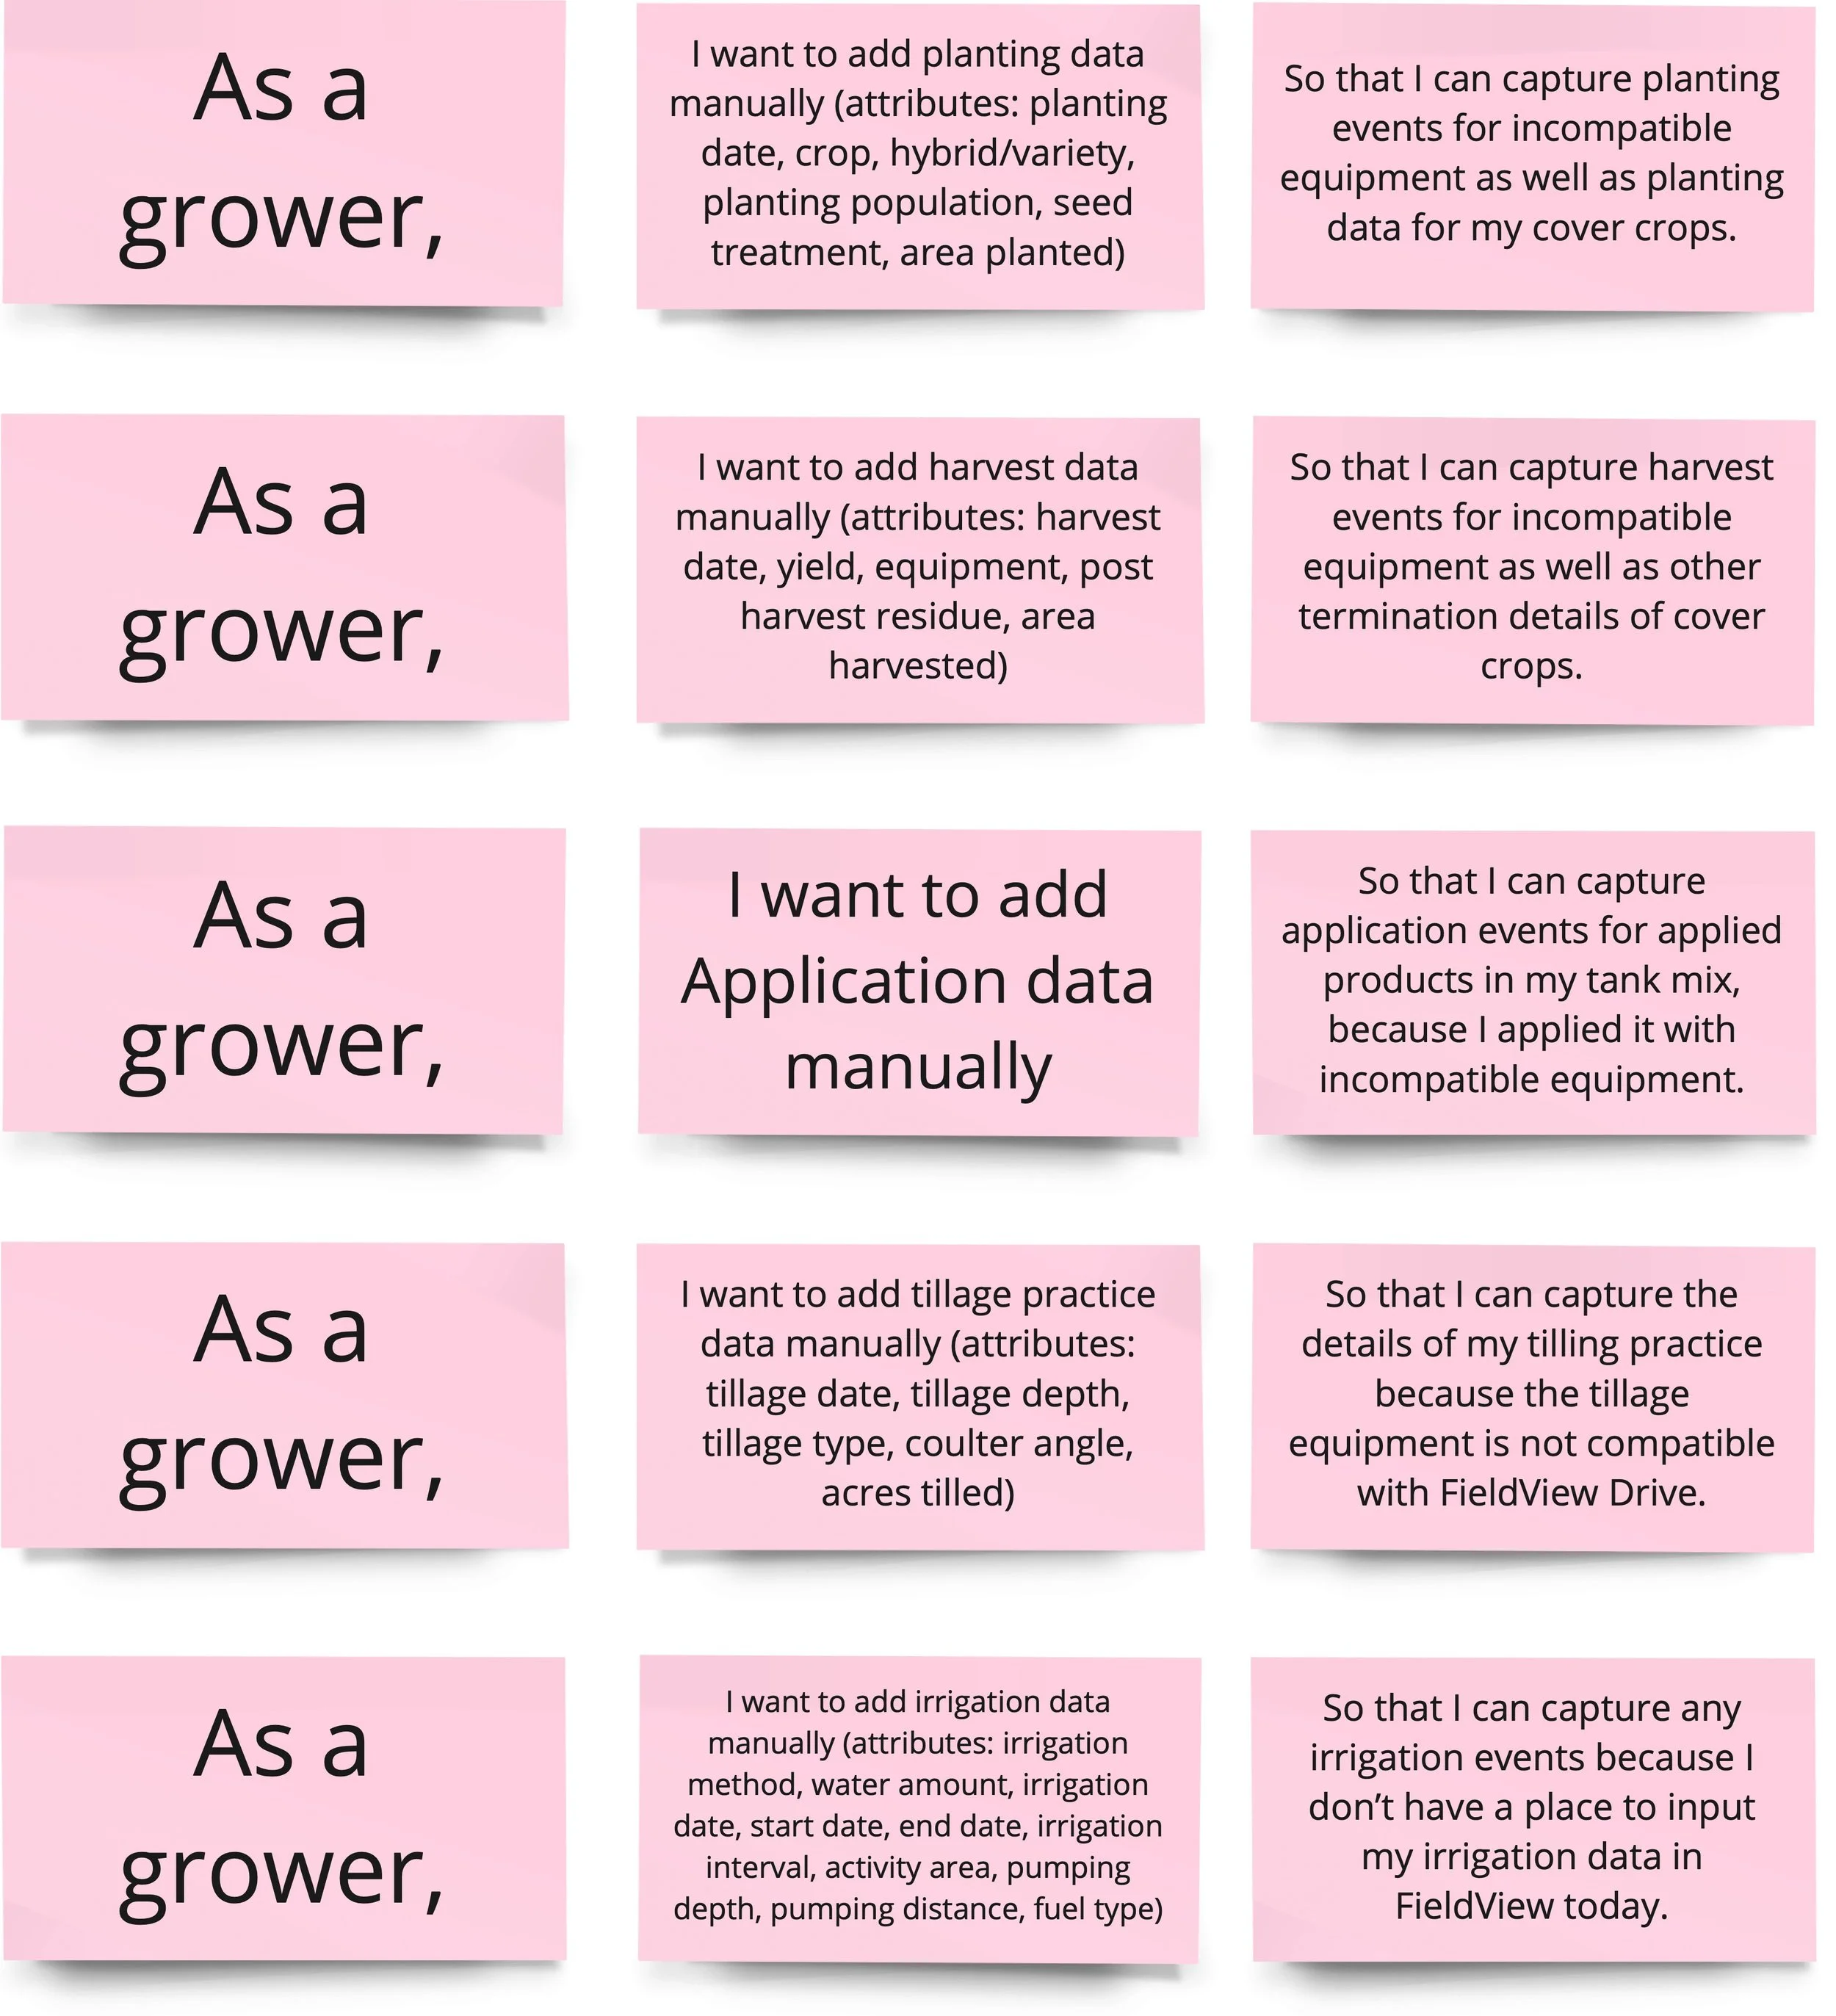
Climate Corporation has farming customers around the globe whose operation sizes and needs vary quite a lot, including their tech proficiency. We needed to provide an interface that would be simple enough for traditional farmers to want to use, and complex enough for more tech-savvy users to be able to interact with their farming operation data in meaningful ways.
Shown here is an example of our User Stories, defined in collaboration with the Product Manager.
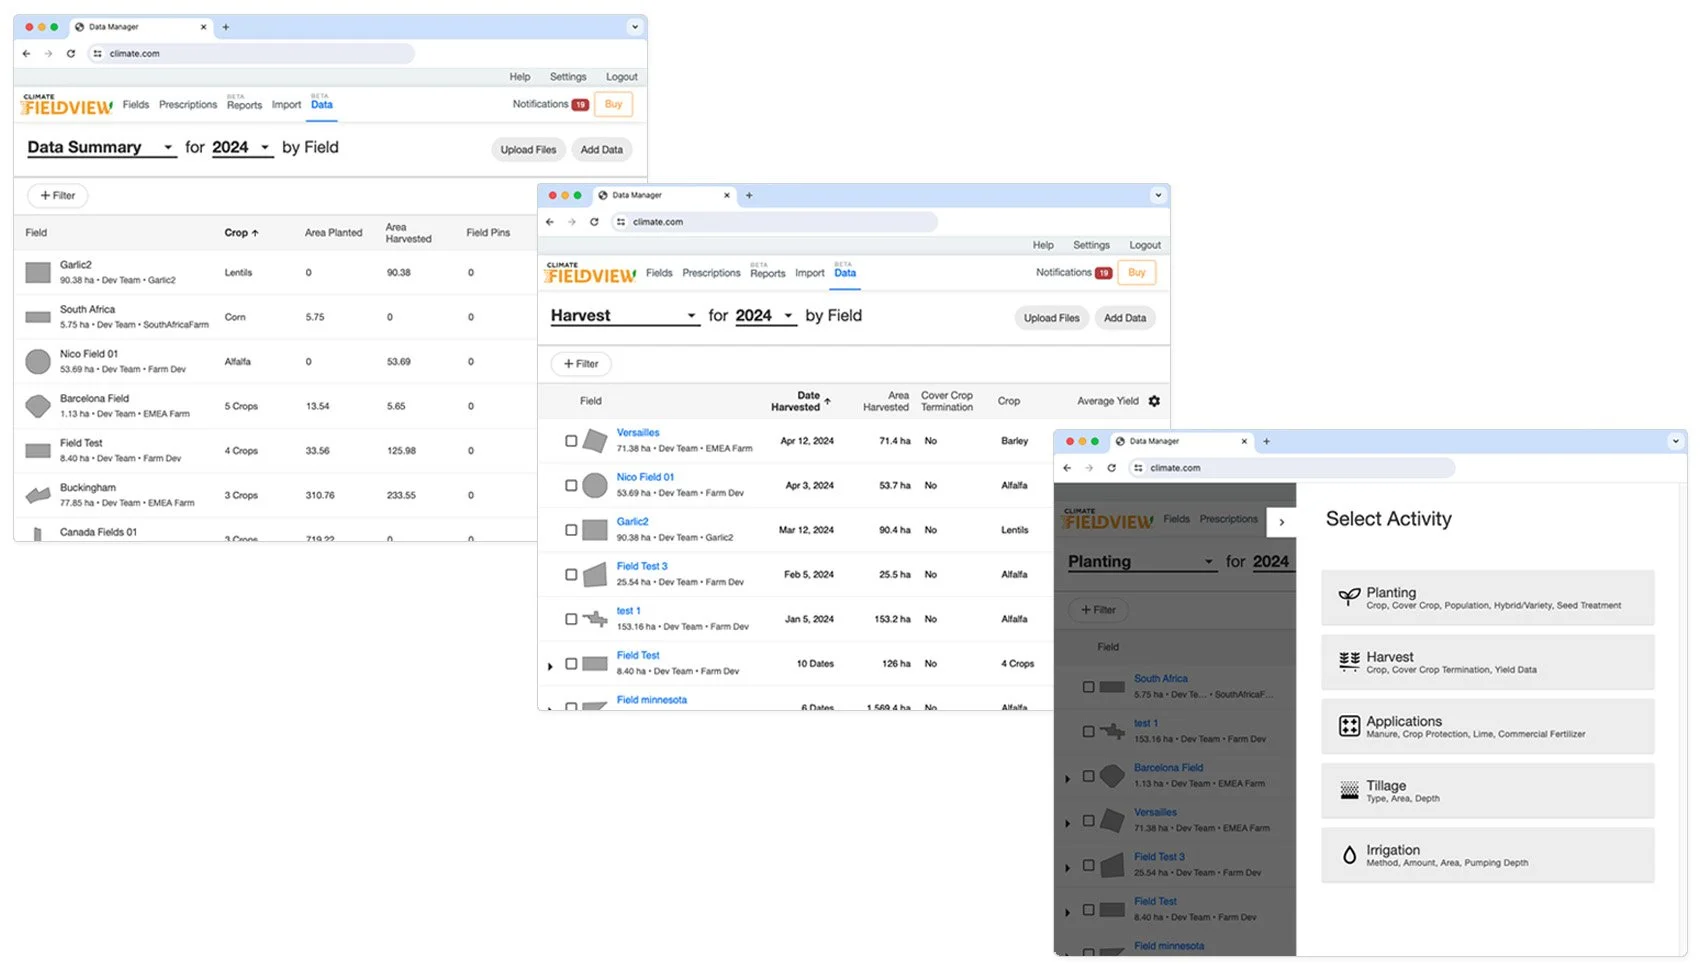
We created a new feature for FieldView, called Data Manager, which was designed to visualize field data across an entire farming operation. We provided functionality that allows customers to review, add, and edit data as well as monitor the impact of their agronomic decisions throughout the changing activities of their annual growing cycles. While the enormous amount of data that needed to be displayed required a table structure, we made sure that the tables are engaging by packing in as many interactive features as possible.
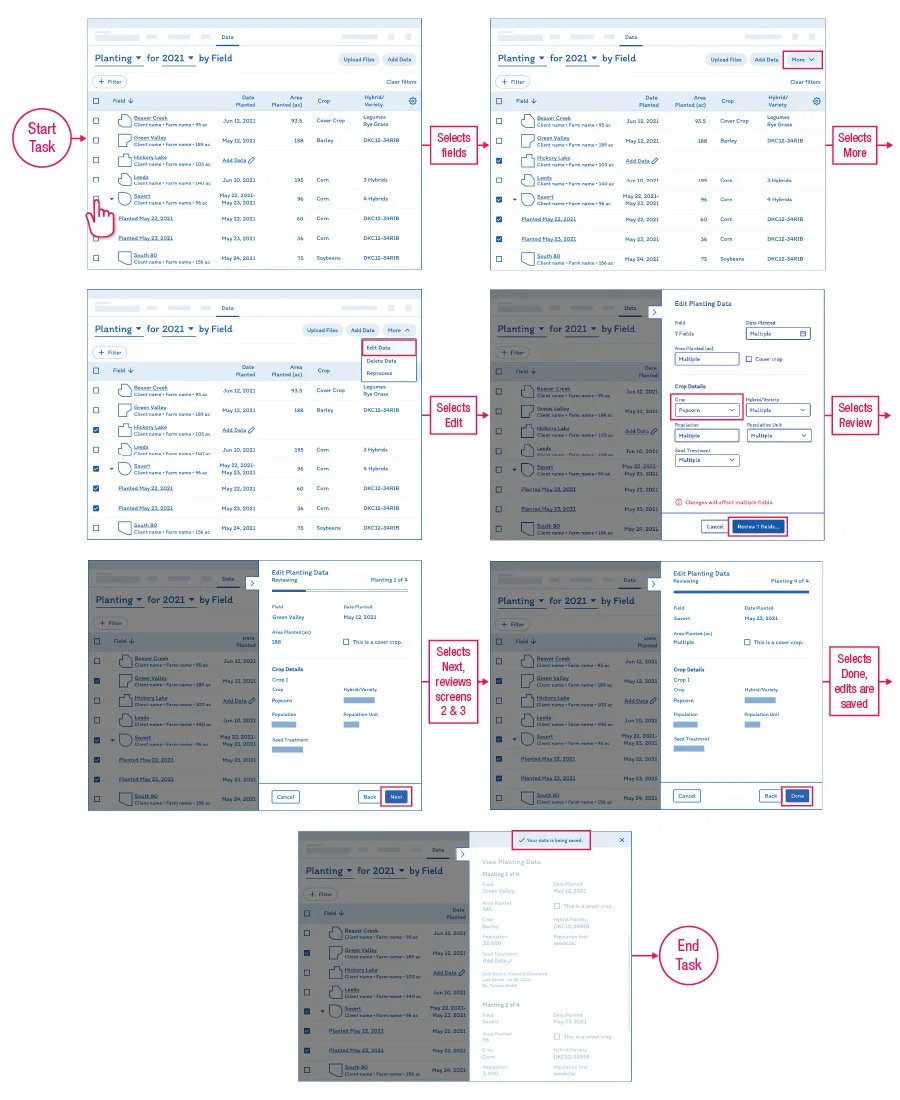
Shown here is an example of one of the numerous wireframe task flows that we created.
3
Solution
As the lead designer for the new Data Manager feature, I collaborated over many months with the product managers, subject matter experts, stakeholders, and the development team in order to research, plan, create wireframes, and deliver final high fidelity designs. I then worked closely with the development team to fine-tune the details and otherwise ensure optimal execution of the feature, in preparation for launch.

Leading a usability testing session.

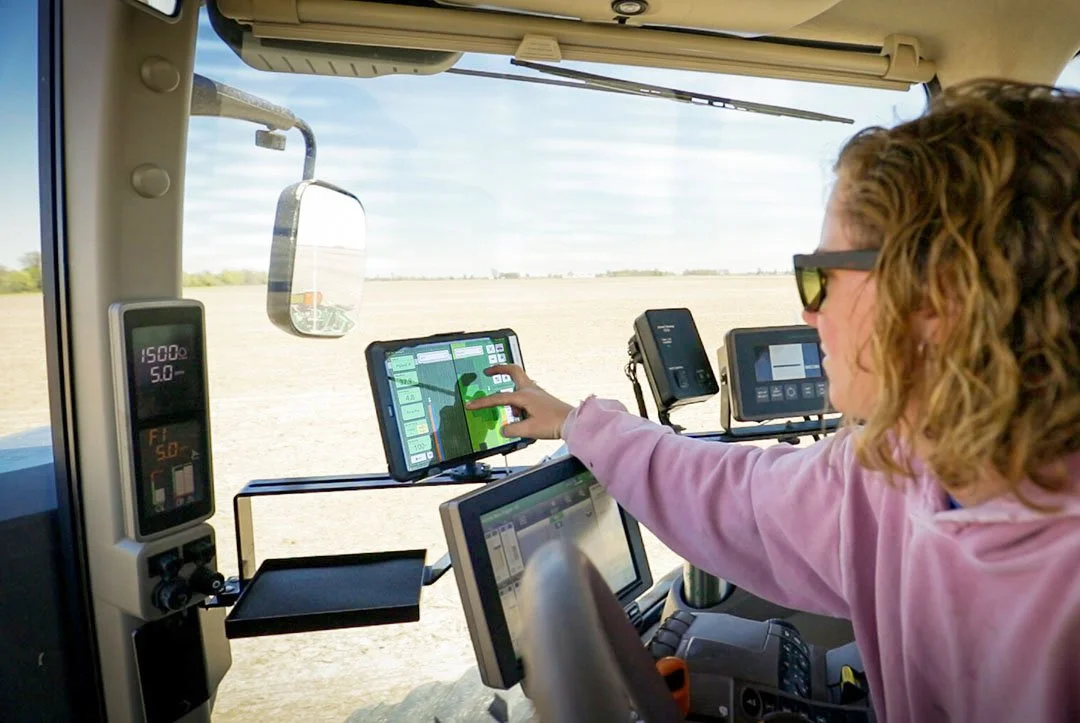
Driving a utility vehicle at an agriculture show in Iowa.
4
Roles
● Conducted user research, competitive analysis, and planning via user journeys, task flows, and user interviews to ensure that we were creating the best solutions for our users' needs.
● Collaborated with product managers throughout the design process, especially on wireframe iterations.
● Created high fidelity designs utilizing the company's design system. Partnered with our visual designer to create new components for our design system, finalize files, and conduct hand-off meetings with our developers.
● Collaborated closely with developers to ensure design details were all executed accurately, and to address any performance issues ahead of launch.
Shown here is an example of one of the numerous wireframe task flows that I created utilizing our design system components.

5
Process
6
Outcome
● Data Manager was well received, both internally and by our users.
● After launch, we conducted usability testing with multiple groups of customers to collect feedback. Most of the feedback focused on functionality already planned for the next iteration of this feature, which confirmed that we’re making the appropriate decisions for our customers’ needs.
● Data Manager also became a hub that other teams at Climate planned to build upon for further functionality for their use cases.
● Data Manager also provided the data required for calculating carbon credits for Bayer ForGround, a program to incentivize farmers to implement regenerative agriculture practices.
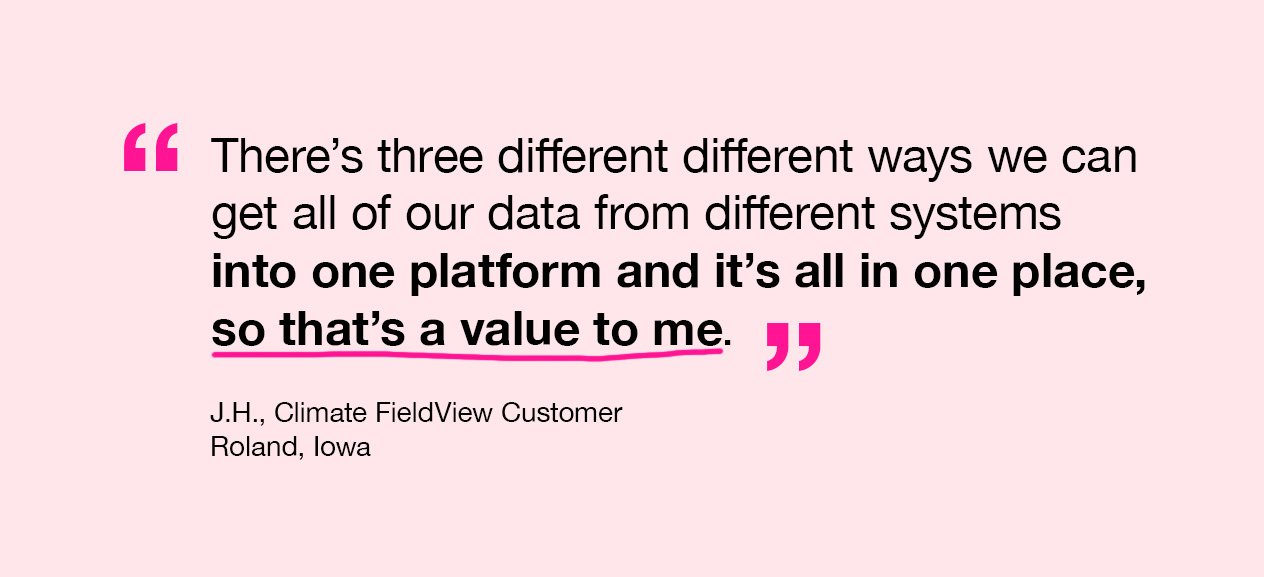
Shown here is a quote from a user who is happy with using Data Manager for his operation.