Case Study 1: Climate FieldView™ Data Manager Feature
Climate Corporation’s customers needed a way to aggregate, review, and edit many years’ worth of farming activity data in a useful and efficient way.

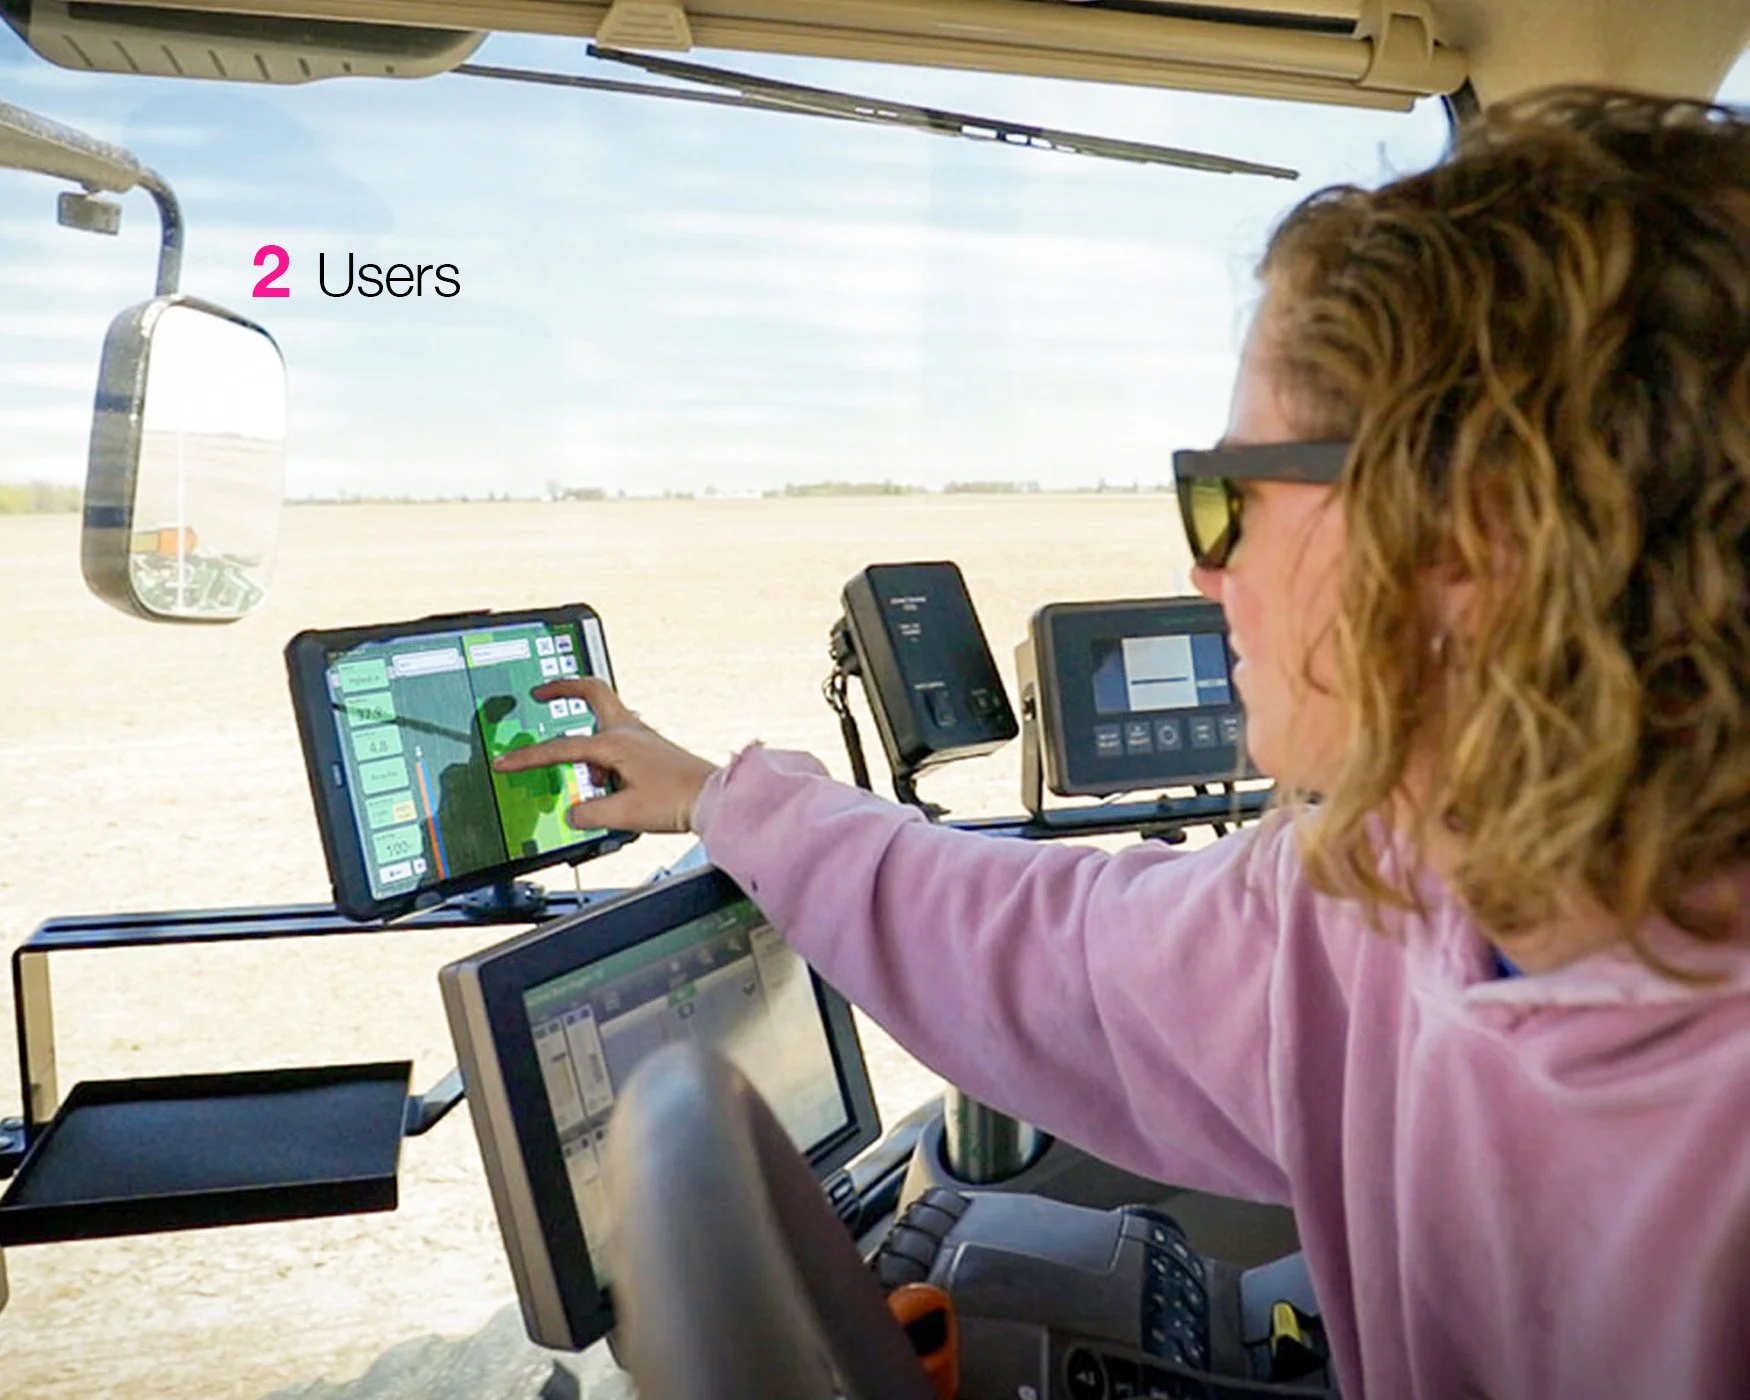
The Climate.com website, known as FieldView™, is Climate’s main tool in its suite of digital products. We needed a way to aggregate and display farming activity data, both the data collected by Climate’s proprietary FieldView Drive, a device installed in farming equipment like tractors, as well as data entered into the system manually. Users need this functionality in order to plan, track and review the planting, harvesting, and other activities on their operations, as well as to forecast revenues. One of our main challenges was to aggregate and display many years' worth of data in a useful and efficient way.
Climate’s farming customers around the globe vary quite a lot, including their tech proficiency. We needed to provide an interface that would be simple enough for traditional farmers to want to use, and complex enough for more tech-savvy users to be able to interact with their farming operation data in meaningful ways.
Climate’s farming customers around the globe vary quite a lot, including their tech proficiency. We needed to provide an interface that would be simple enough for traditional farmers to want to use, and complex enough for more tech-savvy users to be able to interact with their farming operation data in meaningful ways.
Problem: The Climate.com website, known as FieldView™, is Climate’s main tool in its suite of digital products. We needed a way to aggregate and display farming activity data, both the data collected by Climate’s proprietary FieldView Drive, a device installed in farming equipment like tractors, as well as data entered into the system manually. Users need this functionality in order to plan, track and review the planting, harvesting, and other activities on their operations, as well as to forecast revenues. One of our main challenges was to aggregate and display many years' worth of data in a useful and efficient way.

Users: Climate’s farming customers around the globe vary quite a lot, including their tech proficiency. We needed to provide an interface that would be simple enough for traditional farmers to want to use, and complex enough for more tech-savvy users to be able to interact with their farming operation data in meaningful ways.

Solution: We created a new feature for FieldView™, called Data Manager, which was designed to visualize field data across an entire farming operation. We provided functionality that allows customers to review, add, and edit data as well as monitor the impact of their agronomic decisions throughout the changing activities of their annual growing cycles. While the enormous amount of data that needed to be displayed required a table structure, we made sure that the tables are engaging by packing in as many interactive features as possible.

Roles: As the lead designer for the new Data Manager feature, I collaborated over many months with the product managers, subject matter experts, stakeholders, and the development team in order to research, plan, create wireframes, and deliver final high fidelity designs. I then worked closely with the development team to fine-tune the details and otherwise ensure optimal execution of the feature, in preparation for launch.