Case Study 1
Climate FieldView: Data Manager Feature
I helped Climate Corporation deliver a way to aggregate, review and edit many years’ worth of farming activity data in a useful and efficient way, to help users maximize their profits.
Problem and Opportunity
Users of the Climate FieldView product needed a way to engage with their farming data collected by Climate’s FieldView Drive, as well as data entered into the system manually. This functionality is needed to plan, track, review and edit the data for planting, harvesting, and other farm operations, as well as to forecast revenues. Climate recognized this opportunity for deeper engagement with the platform. Over many months we developed a feature to aggregate, visualize, and provide editing functionality for many years’ worth of data in a useful and efficient way. The release was well received by our users.
Users
Climate’s global customers have needs that vary greatly, including their tech proficiency. We needed to provide a feature that traditional farmers would want to want to use, and empower tech-savvy users to interact with their data in meaningful ways. Shown here are an example of the User Stories defined with our Product Manager, as well as a customer in the field.

Roles
As the lead designer, I collaborated with product managers, subject matter experts, and stakeholders in order to research, interview customers, plan, create wireframes, and deliver final designs. I then worked closely with the development team to fine-tune details and ensure optimal execution of the feature.
Solution
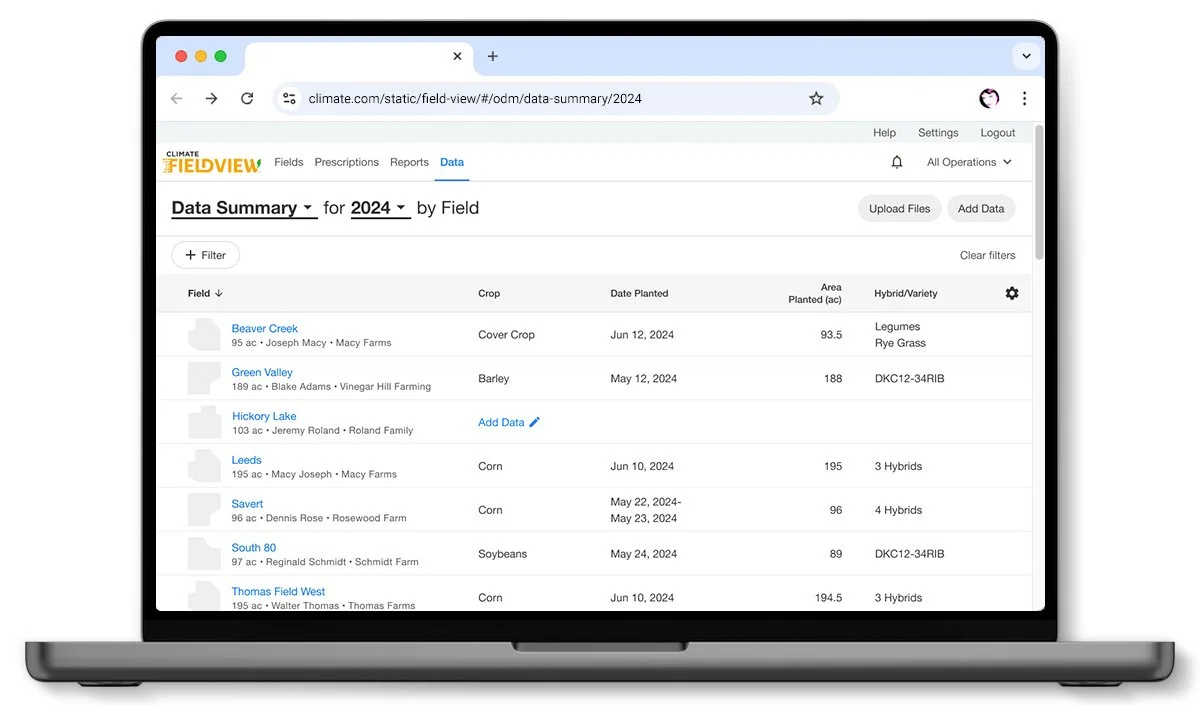
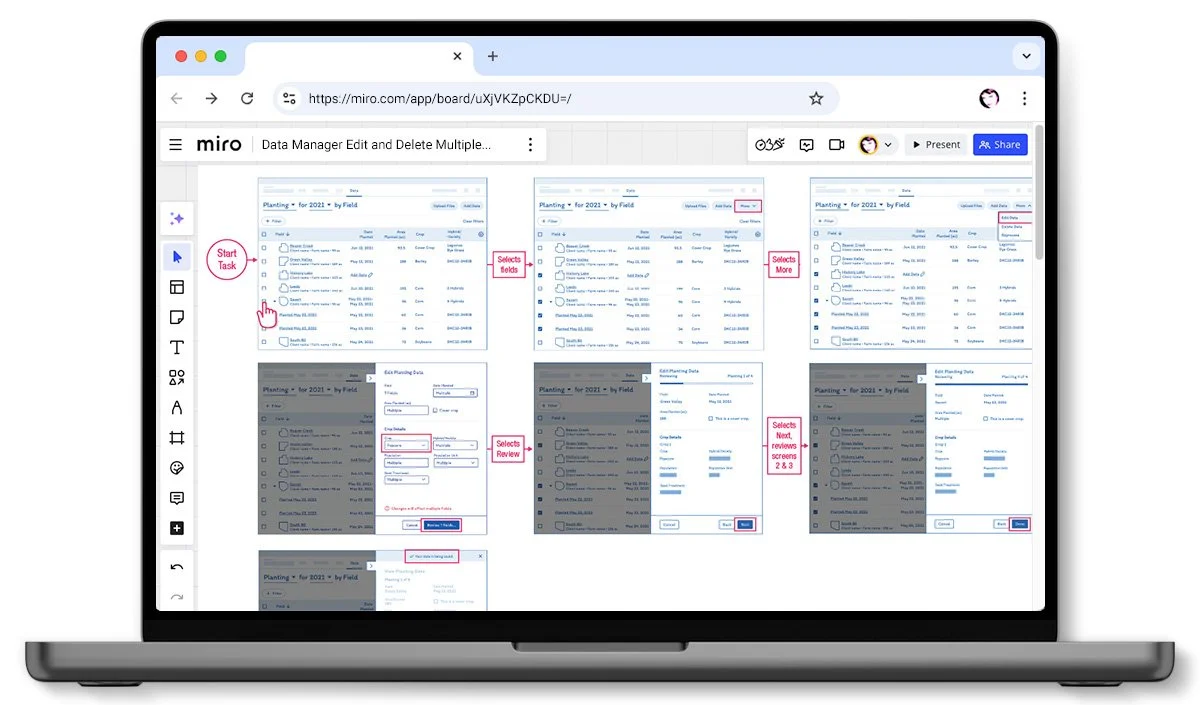
The new Data Manager feature was designed to visualize field data across an entire farming operation. Its functionality allows customers to review, add, and edit data as well as monitor the impact of their agronomic decisions throughout the changing activities of their growing cycles. Displaying the large amount of data required a table structure, plus we packed in as many interactive features as possible. Shown here is one of the numerous wireframe task flows that we created.
Process
● Conducted user research, competitive analysis, and planning via user journeys, task flows, and user interviews to ensure that we were creating the best solution for our users’ needs.
● Collaborated with product managers throughout the design process.
● Created high fidelity designs utilizing the company’s design system.
● Partnered with our visual designer to create new components for our design system, finalize files, and conduct hand-off meetings with our developers.
● Collaborated closely with developers to ensure accurate execution of designs, and address performance issues.
Outcome
● Data Manager was well received, both internally and by our users.
● After launch, we conducted usability testing with customers to collect feedback. Most of the feedback focused on functionality already planned for the next iteration of this feature, which confirmed that we’re making the appropriate decisions for our customers’ needs.
● Data Manager became a hub that other Climate teams planned to build upon, including providing the data required for calculating carbon credits for Bayer ForGround, a program to incentivize farmers to implement regenerative agriculture practices.